The Hurst exponent — Harold Hurst's measure of "memory" in a time series, devised to size the Aswan dam — accurately describes the fractal character of ERCOT electricity prices. But as a stand-alone leading indicator of near-term price spikes, it fails: across 48 (hub × window × horizon) configurations, every ROC-AUC landed between 0.43 and 0.50, never beating a coin. A clean, honest null result — and a pointer toward per-band wavelet methods instead.
A civil servant on the Nile
In the 1940s, an unfussy British civil servant named Harold Edwin Hurst was trying to design the Aswan High Dam. The problem is easy to state and horrible to solve: how big does the reservoir have to be so that the dam never runs dry in a drought and never overtops in a flood?
The Nile’s annual flood records went back roughly 800 years. Hurst waded into them and noticed that the river did not behave the way classical probability theory said it should. Floods clustered. Droughts clustered. A run of wet years made another wet year likelier, not less likely. The river had memory.
He boiled the effect down to a single number. Rescale the range of cumulative deviations by the standard deviation, plot against window size, fit a line, and read off its slope. That slope is the Hurst exponent, conventionally written H. It lives between 0 and 1:
- H = 0.5 — coin-flip independence. A random walk. No memory.
- H > 0.5 — persistent. Trends continue. Wet years follow wet years.
- H < 0.5 — anti-persistent. Mean-reverting. Up-days followed by down-days.
Hurst measured H ≈ 0.7 on the Nile, sized the dam accordingly, and accidentally gave Mandelbrot a career. The exponent turned out to apply to rather more than hydrology: stock returns, heartbeats, network traffic, river flows on four continents, and — as we shall see — the wholesale price of electricity in Texas.
It is a beautiful tool. The question in front of us is whether it is a useful tool, which is an entirely different and much nastier question.
Electricity markets for people who have better things to do
Electricity is the only commodity in civilian life that must be produced at the exact instant it is consumed. There is no warehouse. Batteries help at the margins but do not change the basic physics: generation and demand must match, continuously, or the grid falls over.
Wholesale markets exist to coordinate this. Every few minutes, operators run an auction. Generators bid the price they will accept to produce the next block of megawatt-hours. The market clears at a single price that everyone producing in that interval gets paid. Most of the time it is boring — $20, $30, $50 per megawatt-hour. And then, occasionally, it is not: demand surges, a generator trips, the wind stops, cheap capacity is exhausted, and prices detonate.
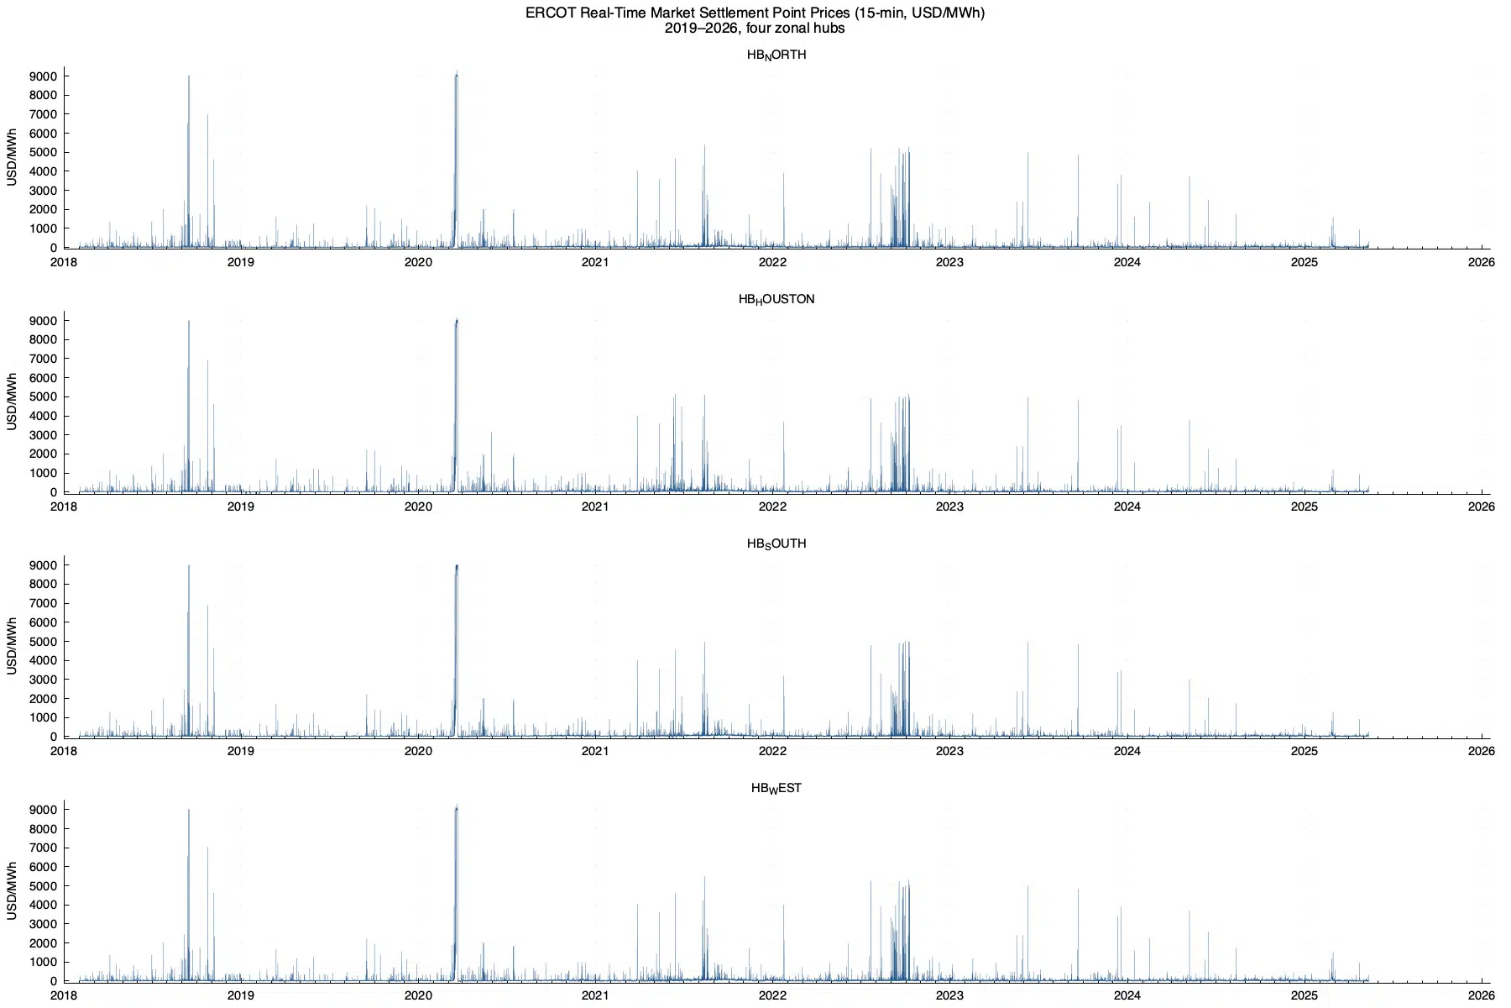
Knowing a spike is coming is worth a great deal of money. It is also worth a great deal of not-dying, if you happen to be running a dialysis machine at the time. Which is why anyone with a background in time-series analysis, and a surplus of spare weekends, eventually looks at the ERCOT price tape and asks: is there a signal hiding in here?
Capacity markets, and the absence thereof
Most grids run a capacity market alongside the energy market. Generators are paid simply for being available — a retainer, whether they run or not. The logic is insurance: it socialises the cost of reserve margin so the peaker plant exists when the heatwave arrives.
Texas does not do this. ERCOT is an energy-only market. Generators get paid for electricity they produce, and nothing else. The only signal that the system is running short of reserves is the price itself, which is allowed to go mental — a ceiling of $9,000/MWh before 2022, lowered grudgingly to $5,000/MWh after. Both are absurdly high, and deliberately so: in an energy-only market, scarcity pricing has to do the job a capacity payment does elsewhere. This makes Texas electricity cheaper on average than almost anywhere in the developed world — and the most volatile energy-only wholesale market on the planet. It is the ideal natural experiment. If a fractal precursor to spikes exists anywhere, it exists here.
Why Hurst might save Texas (spoiler alert)
Classical forecasting tools — ARIMA models, LSTMs — are fundamentally averaging machines. They are excellent at predicting next Tuesday’s typical price and uselessly bad at predicting next Tuesday’s spike, because the spike lives in the fat tail the averaging ignores. The Hurst exponent is different. It does not try to predict the next value; it measures the character of the memory in the signal.
The hypothesis: before a regime transitions from calm into a scarcity event, its memory structure ought to change. That shift, if it exists, is the leading indicator. Measure Hurst on a rolling window, watch for the characteristic move, alert the dispatcher, make money and save lives. That’s the hypothesis. Let’s go break it.
The experiment
Seven years of ERCOT real-time settlement prices at 15-minute resolution, across all four zonal hubs. Roughly 245,000 samples per hub; one million in total. 2019 through 2025. Winter Storm Uri included, treated honestly: run with the storm in, run again with the worst 0.5% of prices stripped, report both.
The codebase is C11, libc and libm only. Gnuplot for figures. XeLaTeX for the document. No Python. Before pointing any new number at Texas, the toolchain was validated against a sibling project’s European (EPEX) data, reproducing a published whitepaper table to seven decimal places.
Global scaling. ERCOT prices are highly persistent, H ≈ 0.84 — almost exactly the same as European power markets. ERCOT returns are strongly mean-reverting, H ≈ 0.30. Prices drift with memory; individual jumps reverse within minutes.
Regime segmentation. Slicing by season × time-of-day × day-of-week, winter overnight stretches show the longest memory; shoulder-season afternoons the shortest. HB_WEST — the wind-heavy hub, where surplus West Texas wind regularly drives prices negative — behaves visibly differently from the other three.
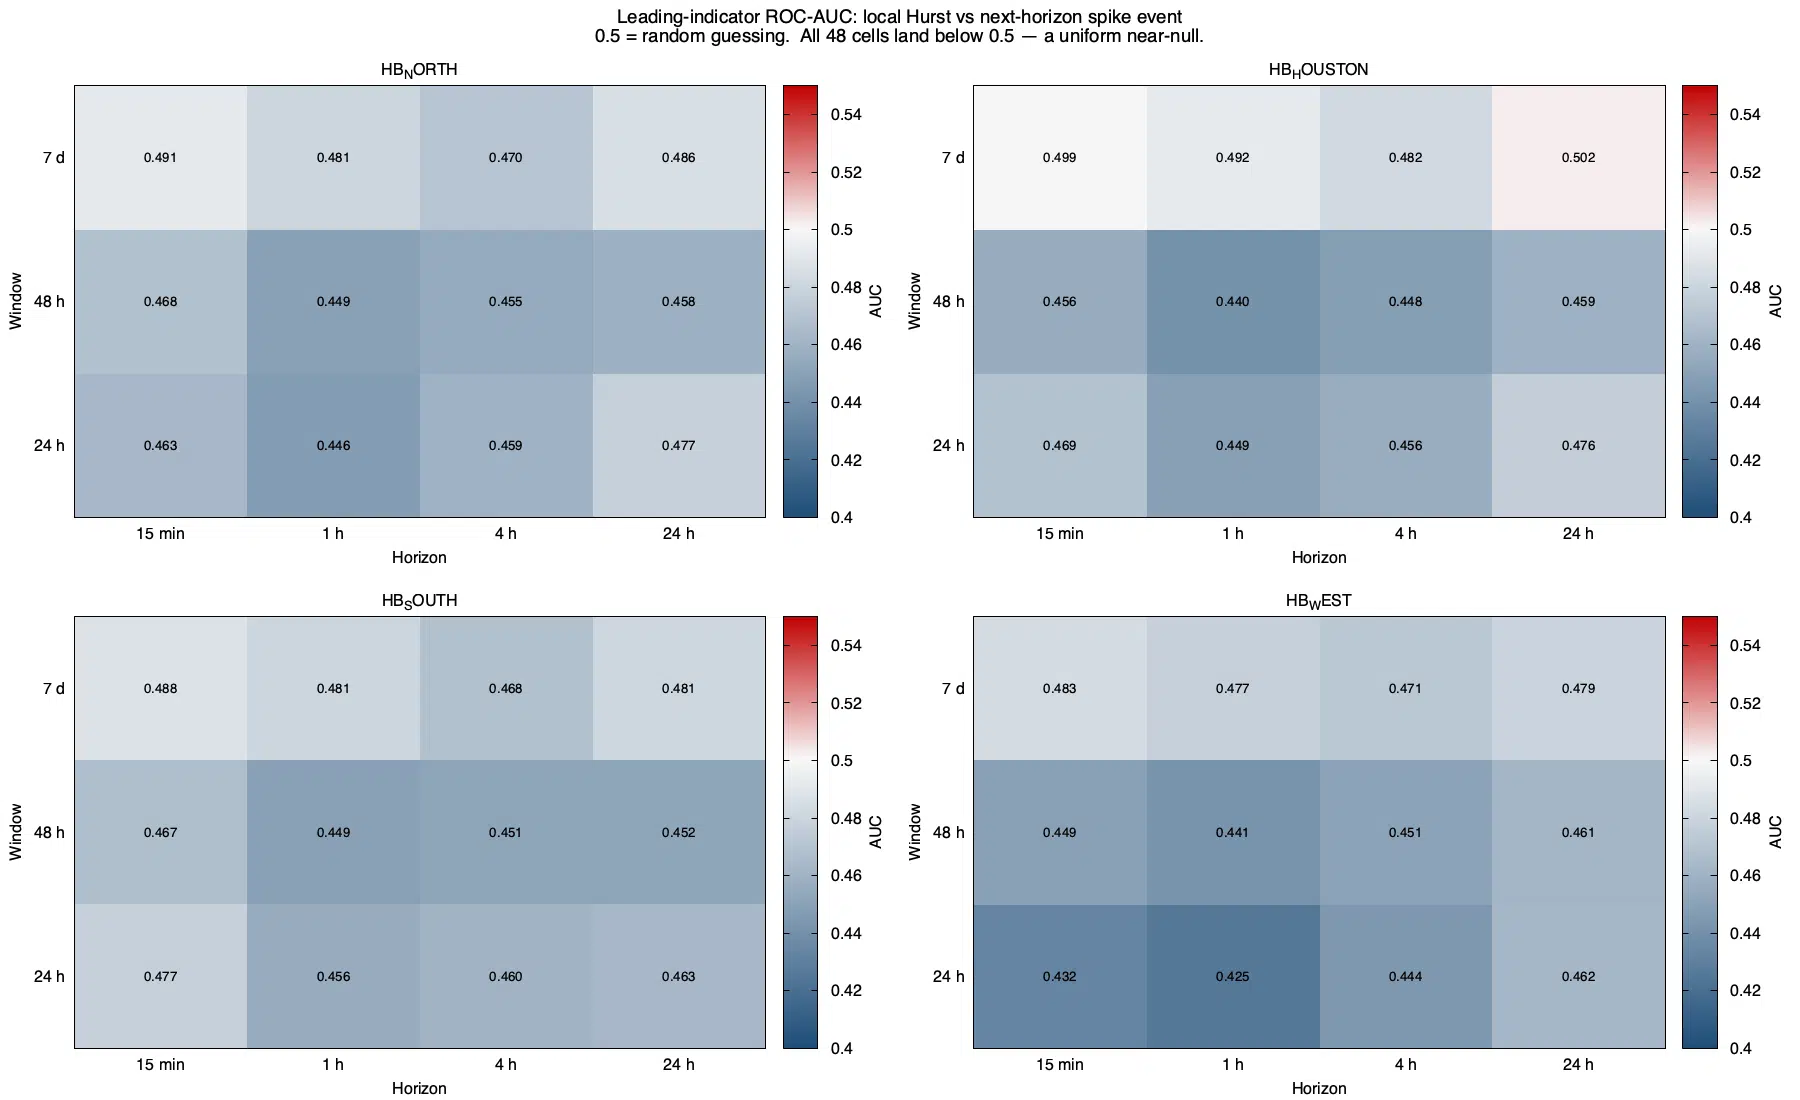
The headline experiment. Compute Hurst on a rolling window across the full seven years. Three window sizes (24h, 48h, 7 days); four look-forward horizons (15 min, 1h, 4h, 24h). A “spike” is any price crossing the trailing 30-day 95th percentile. The question becomes a binary classification — from the local Hurst right now, discriminate “spike incoming” from “no spike incoming” — scored with ROC-AUC (1.0 = perfect oracle, 0.5 = a coin). Four hubs × three windows × four horizons = 48 cells, each run raw and event-stripped. No cherry-picking.
The result
Every one of the 48 cells lands between AUC 0.43 and 0.50. Zero cells above 0.5. All the uncertainty around 0.5 lives on the wrong side of it, consistently, across every hub and every window and every horizon.
A follow-on check — comparing the distribution of local Hurst in the 24 hours before a spike against matched non-spike windows — produced the same answer from the opposite angle. The two distributions differ by about 0.022 in mean against a within-class spread of roughly 0.11, and that gap vanishes entirely once the event-stripped series is used. Two independent tests, same direction, same inoperative effect size.
So the answer is no
Rolling local Hurst, as a stand-alone leading indicator of near-term price spikes on ERCOT, does not work. The evidence is as clean as a negative result ever gets: 48 cells, uniform direction, all below 0.5, cross-confirmed, robust to event-stripping. It is also honest: the toolchain reproduced a prior published result exactly; the data passed every sanity check; the test grid was predeclared. There is nowhere for the result to hide.
Why it doesn’t work
First, the uninteresting reason. ERCOT scarcity spikes are frequently exogenous. Winter Storm Uri was not an emergent feature of fractal price dynamics; it was a frozen gas pipeline in Pampa. A Hurst exponent is a property of endogenous dynamics. It cannot see a weather system coming.
Second, the interesting reason. ERCOT’s price is a composite signal — a slow demand cycle, a medium-frequency supply cycle, a fast dispatch-noise process, and a spike process in the tails. Rolling Hurst collapses all of that into a single scalar per window. If the predictive information lives at one specific frequency band, averaging across bands is exactly the wrong move; the signal gets diluted into noise before it reaches the classifier.
We went hunting megalodons with a bathroom scale and are now reporting that the bathroom did not contain any megalodons. This is true, but perhaps not conclusive.
What would actually work, if anything does, is something that preserves the frequency-band structure: wavelet decomposition of the price signal, computing Hurst per band, asking the predictive question at each scale separately. Or a multi-factor classifier that takes local Hurst as one feature among several. Or a change-point detector that models the scarcity process directly. All tractable follow-ons — but none of them are the answer to “does Hurst, by itself, predict ERCOT spikes.” That question has an answer, and the answer is no.
The moral of the story
A clean null result on a sharply-posed question is worth more than a mushy positive on a vague one. Harold Hurst measured the Nile and sized a dam that has not run dry in sixty years. The exponent that bears his name accurately describes the memory of ERCOT prices. It just does not, by itself, tell you when the lights are about to go out in Texas. There are worse things to learn at the cost of one weekend of C and a few million CPU-seconds.
Toolchain: ~1,500 lines of C11 (libc + libm only), gnuplot, xelatex. Data: ERCOT NP6-785-ER, 2019–2025, 15-minute real-time settlement point prices, four zonal hubs.
Download the full whitepaper (PDF) →
Where Full Stack Energy fits
If you’re working on a quantitative problem in energy markets and want analysis that tells you what’s true rather than what you hoped to find, get in touch. The per-band approach this points toward is exactly the thinking behind our wavelet dispatch work and structure-aware control.