
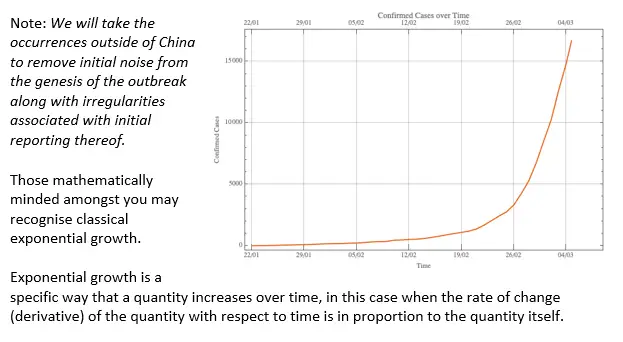
The John Hopkins Whiting School of Engineering GitHub repository holds a wealth of up to date and regularly updated, data on the spread of Covid-19. Let’s take a look at how the number of confirmed cases has changed outside of China as it spreads across the world.
he classic function for the exponential growth of x is given by:

Where t is the time period and r is the growth rate.
The growth rate consists of two elements
- The average number of people an infected person is exposed to in one day (E)
- The probability of each such exposure resulting in a new infection (P)
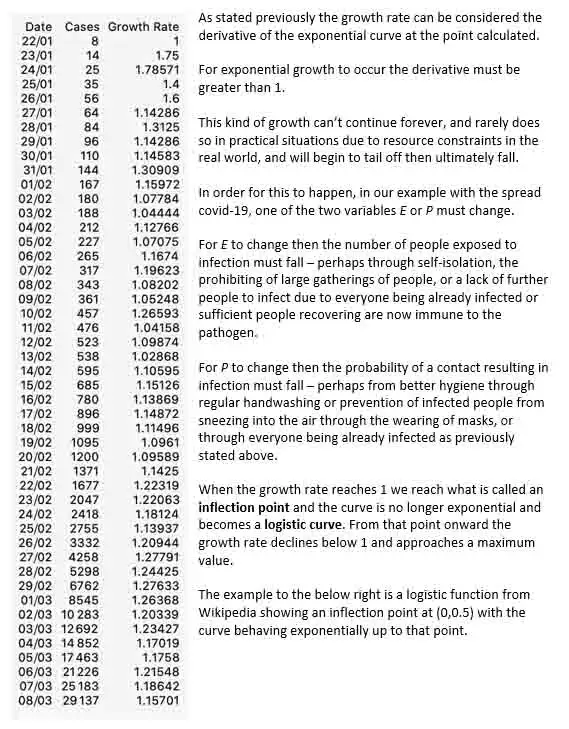
Computing the growth rate (EP) is achieved by calculating the ratio between the number of confirmed cases on day t and the number of confirmed cases on day t-1.
If we assemble a table of the number of confirmed cases over time (the basis for the previous chart) and use the method outlined in the previous paragraph we can compute the growth rate for each time period (in this case, per day).
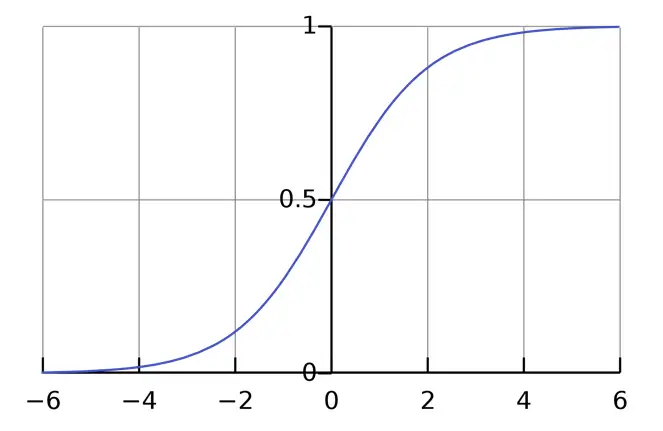
The example to the right is a logistic function from Wikipedia showing an inflection point at (0,0.5) with the curve behaving exponentially up to that point.
As a rule of thumb is the total number of infections, for our example, it will be twice that at the inflection point.
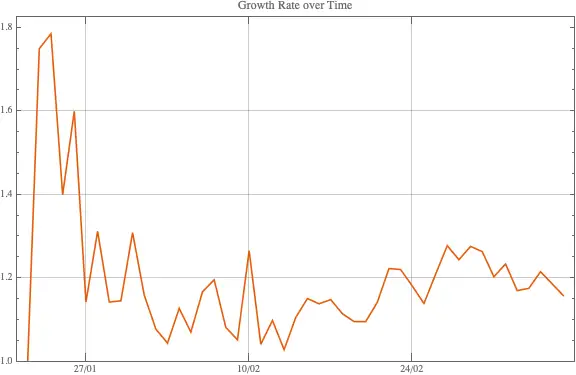
Plotting our growth rate we see that it remains around 1.2 with only a slight indication of a downward trend, so far. It may be that we have some time to go before it approaches 1.
Knowing the growth rate figure allows us to make projections for the number of infections at some point in the future if the growth rate remains steady. (Indeed, we can also project based on changes to the growth rate based on changes in E, P or both as a result of changing circumstances).
Example:
Confirmed case projections, outside China, over a period of weeks and growth rates.
Note: No account is taken of overall world population or the number of already infected cases in this simplistic projection.
| Date | r = 1.1 | r = 1.15 | r = 1.2 |
| 1 week | 56,779 | 77,505 | 104,403 |
| 4 weeks | 420,184 | 1,458,762 | 4,803,079 |
| 8 weeks | 6,059,478 | 73,033,799 | 791,761,924 |
As you can see, even a small change in the growth rate elicits a dramatic change in the number of predicted confirmed cases – especially over time.
To discuss any of the information outlined above, contact us by clicking below and request to speak to one of our specialists.


