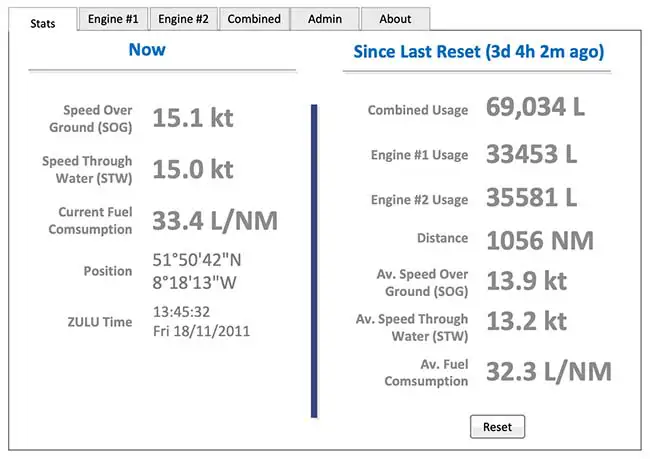
A maritime fleet was burning a lot of diesel, and rising costs made it hurt. We built a bridge-mounted display that turns engine data into a simple efficiency signal — green for good, red for bad — so officers can find the most efficient throttle setting in the moment.
The client is a maritime organisation operating a large fleet of vessels with high running costs. With ships burning significant fuel and diesel costs rising, they wanted to improve vessel energy efficiency by gathering and analysing consumption data, then acting on the insights. Full Stack Energy developed a custom turn-key energy metering and reporting solution to monitor the fleet's engine efficiency — centred on a bridge-mounted display that helps officers find the most efficient throttle settings, with twelve months of engine data stored on board and securely transmitted to shore for analysis.
The client operates a large fleet of vessels with high running costs, and the ships were burning a significant amount of fuel. With diesel costs generally increasing, that inefficiency translated straight into rising operating expense — so they wanted to improve the energy efficiency of their vessels.
The route to that was data: gather and analyse fuel-consumption information, then leverage the insights to enact more efficient operations. But raw consumption data sitting in a system somewhere doesn’t change how a ship is driven — the people at the controls need to see it.
Working through the problem, it was determined that a bridge-mounted display would help officers find the most efficient throttle settings in real time — with twelve months of engine data stored on board and securely transmitted to shore for deeper display and analysis.
The insight had to reach the officer at the throttle, instantly and unambiguously. So we built a display designed for a working bridge, backed by robust on-board storage and secure transmission to shore.
A captain won't read a dashboard mid-manoeuvre — but they'll glance at a light that's gone from green to red. The simplest possible signal is what actually changes behaviour.
Lead Engineer, Full Stack Energy
Full Stack Energy built a robust and secure system that lets officers develop and enforce efficient operating practices through simple trend analysis and occasional checks of the efficiency display. Because the feedback is instant, officers can take immediate action to gain efficiencies of 10% or more — driving real savings in the fleet’s single biggest controllable cost.
The system integrates fully with the client’s existing Advisor installation, giving centralised tracking of all fuel and energy usage across land and sea, and the installation itself is relatively quick and painless, with little or no disruption to operations.
The whole design hinges on a behavioural truth: nobody changes how they drive a ship by reading a report back in port. The red-amber-green display works because it gives the officer feedback at the exact moment they’re choosing a throttle setting. Simplicity wasn’t a compromise here — it was the feature.
Storing a full year of data on board mattered more than it sounds. Connectivity at sea is unreliable, so the vessel has to be its own source of truth, then reconcile with shore when it can. Designing for the gaps is what makes the shore-side analysis trustworthy.
It turns engine data into a simple red/amber/green efficiency signal officers can read at a glance, right where the throttle decision is made. Because the feedback is instant, officers can adjust to the most efficient setting in the moment — gaining efficiencies of 10% or more on the fleet's single biggest controllable cost.
Because nobody changes how they drive a ship by reading a report back in port. A captain won't study a dashboard mid-manoeuvre, but they'll glance at a light that's gone from green to red. The simplest possible signal is what actually changes behaviour at the controls.
Each vessel stores twelve months of engine data on board, so trends hold up even with intermittent connectivity, then securely transmits to shore for deeper analysis. It also integrates with the client's existing Advisor installation for centralised tracking of fuel and energy across land and sea.
If the number arrives too late to act on, it's a report, not a control. We build feedback people use in the moment. Let's talk.