Benford's Law predicts that the leading digit 1 appears about 30% of the time, with each higher digit progressively rarer — a pattern that holds most strongly when values span many orders of magnitude. Running the first-digit test over 150 million records of 15-minute interval energy data, the distribution tracks Benford's curve almost exactly. That close fit is a quiet proof of large-scale data-acquisition integrity.
Here’s what the textbook says: Benford’s Law, also called the first-digit law, refers to the frequency distribution of digits in many (but not all) real-life sources of data. In this distribution, 1 occurs as the leading digit about 30% of the time, while larger digits occur less frequently — 9 appears first less than 5% of the time. The law also concerns the expected distribution of digits beyond the first, which approach a uniform distribution.
It has been shown to apply to a wide variety of datasets — electricity bills, street addresses, stock prices, population numbers, death rates, lengths of rivers, physical and mathematical constants, and processes described by power laws (which are very common in nature). It tends to be most accurate when values are distributed across multiple orders of magnitude.
Does it apply to energy data?
To find out, I ran a first-digit query over 150 million records of 15-minute energy data I had lying around. Here is the distribution of leading digits:
| Leading digit | Count |
|---|---|
| 1 | 49,647,887 |
| 2 | 27,419,091 |
| 3 | 18,099,660 |
| 4 | 14,904,116 |
| 5 | 13,496,329 |
| 6 | 10,929,017 |
| 7 | 9,671,925 |
| 8 | 7,708,455 |
| 9 | 6,564,295 |
The vast majority of the data analysed are electricity usage readings measured in watt-hours, though there are gas and water usage figures in there too. I left out negative numbers for simplicity — negatives can legitimately occur when energy is being produced and exported.
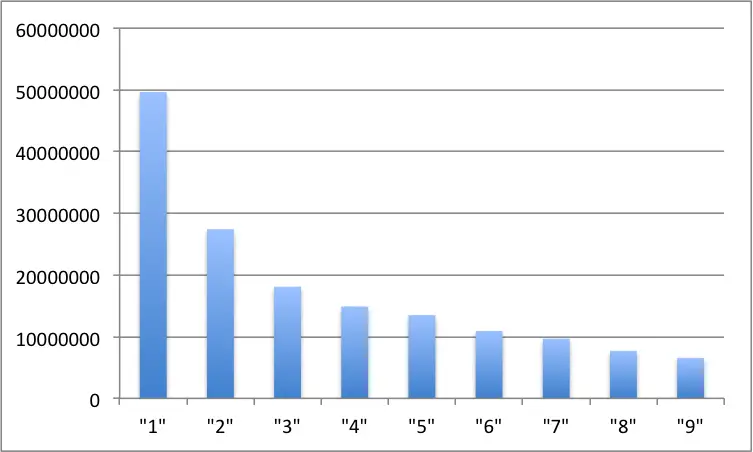
Benford’s Law is alive and well in 15-minute energy data — and that’s more than a curiosity.
Why does it matter?
In the case of our energy data, the close fit demonstrates the veracity of the readings and the effectiveness of our data acquisition and management at scale — and it’s just kind of interesting. If you’d like the query that produced this, it’s in the companion post, Benford’s Law and Energy Data: The SQL. The same instinct — letting the numbers reveal whether they can be trusted — scales up to AI-powered anomaly detection.